Webapps that make your processvisible.
Machine data, order flows and customer info in one webapp or dashboard. For manufacturers, machine builders and SME doers who want to steer on facts, not gut feel.
Four ways to make your process visible and steerable.
I focus on webapps that bring data from machines, systems and people together. Start small, expand what works — no off-the-shelf package to squeeze into.
IoT & machine data (MQTT → dashboard)
Read machines and sensors over MQTT, store them in a database and visualise in Grafana or a custom webapp — also for Wise4012, Siemens LOGO or older machines with no built-in interface.
- MQTT broker & data capture
- Wise4012 / Siemens LOGO
- Retrofit older machines
- Grafana or custom UI
Production insight (MES-light)
See OEE, downtime, order status and line load. One screen for the shop floor and the office — without a 12-month MES rollout.
- OEE & downtime tracking
- Live order status
- Digital work orders
- Load per line
Custom CRM & internal tools
A CRM, quoting system or internal webapp that fits your process. Not a package that does 80% — a custom tool that fits 100%.
- Customers & quotes
- Stock & orders
- Job tracking
- Integrate with existing systems
Dashboards & reports
Existing data sources (Excel, ERP, PLC, database) turned into clear dashboards and reports. Live numbers you can act on — with smart alerts where they help.
- KPI dashboards
- Automated reports
- Smart alerts
- Grafana / custom UI
Websites, portals and apps that actually get used.
From a calm app for customers to a daily tool for your team — built to feel good to use every day. Tap a phone to read more.
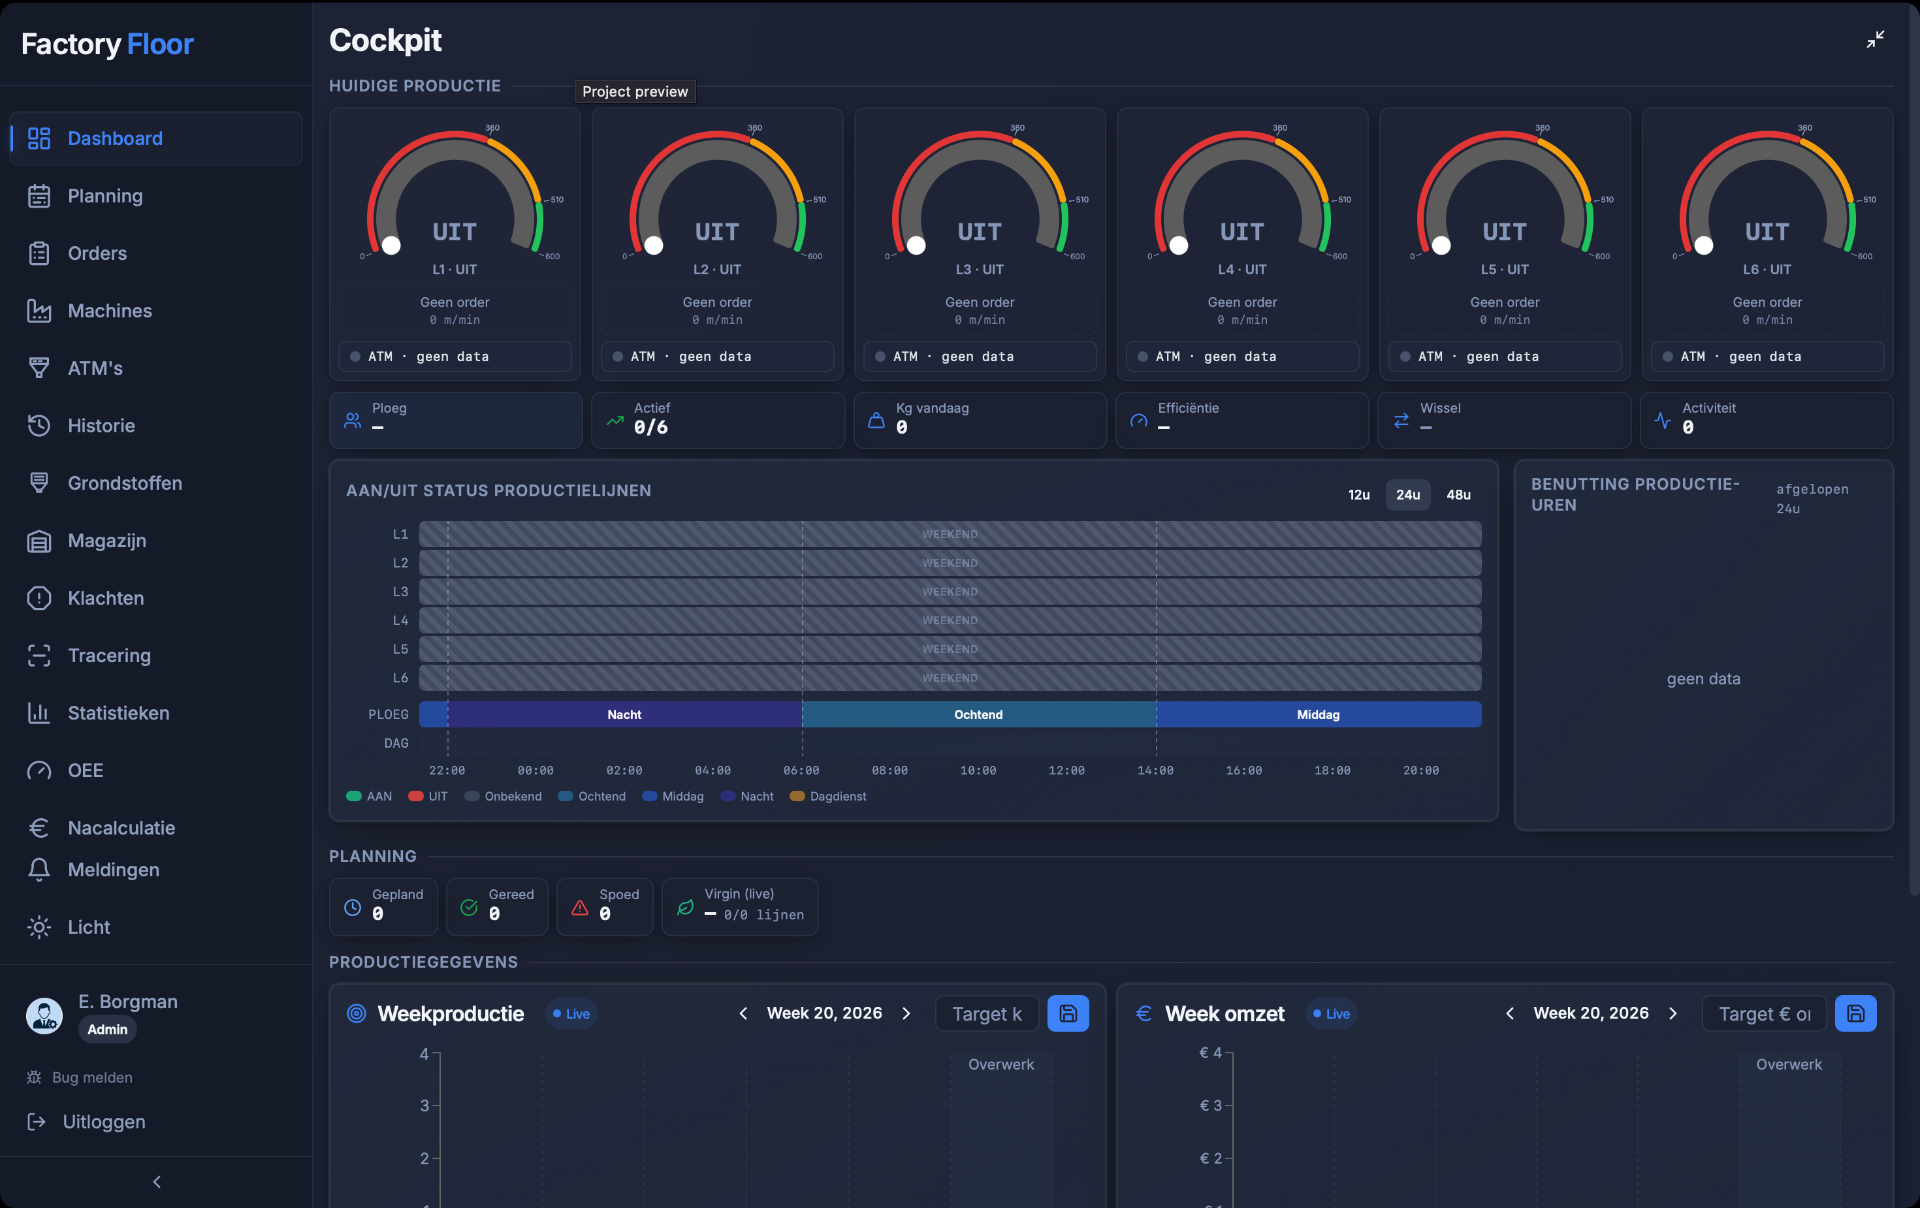
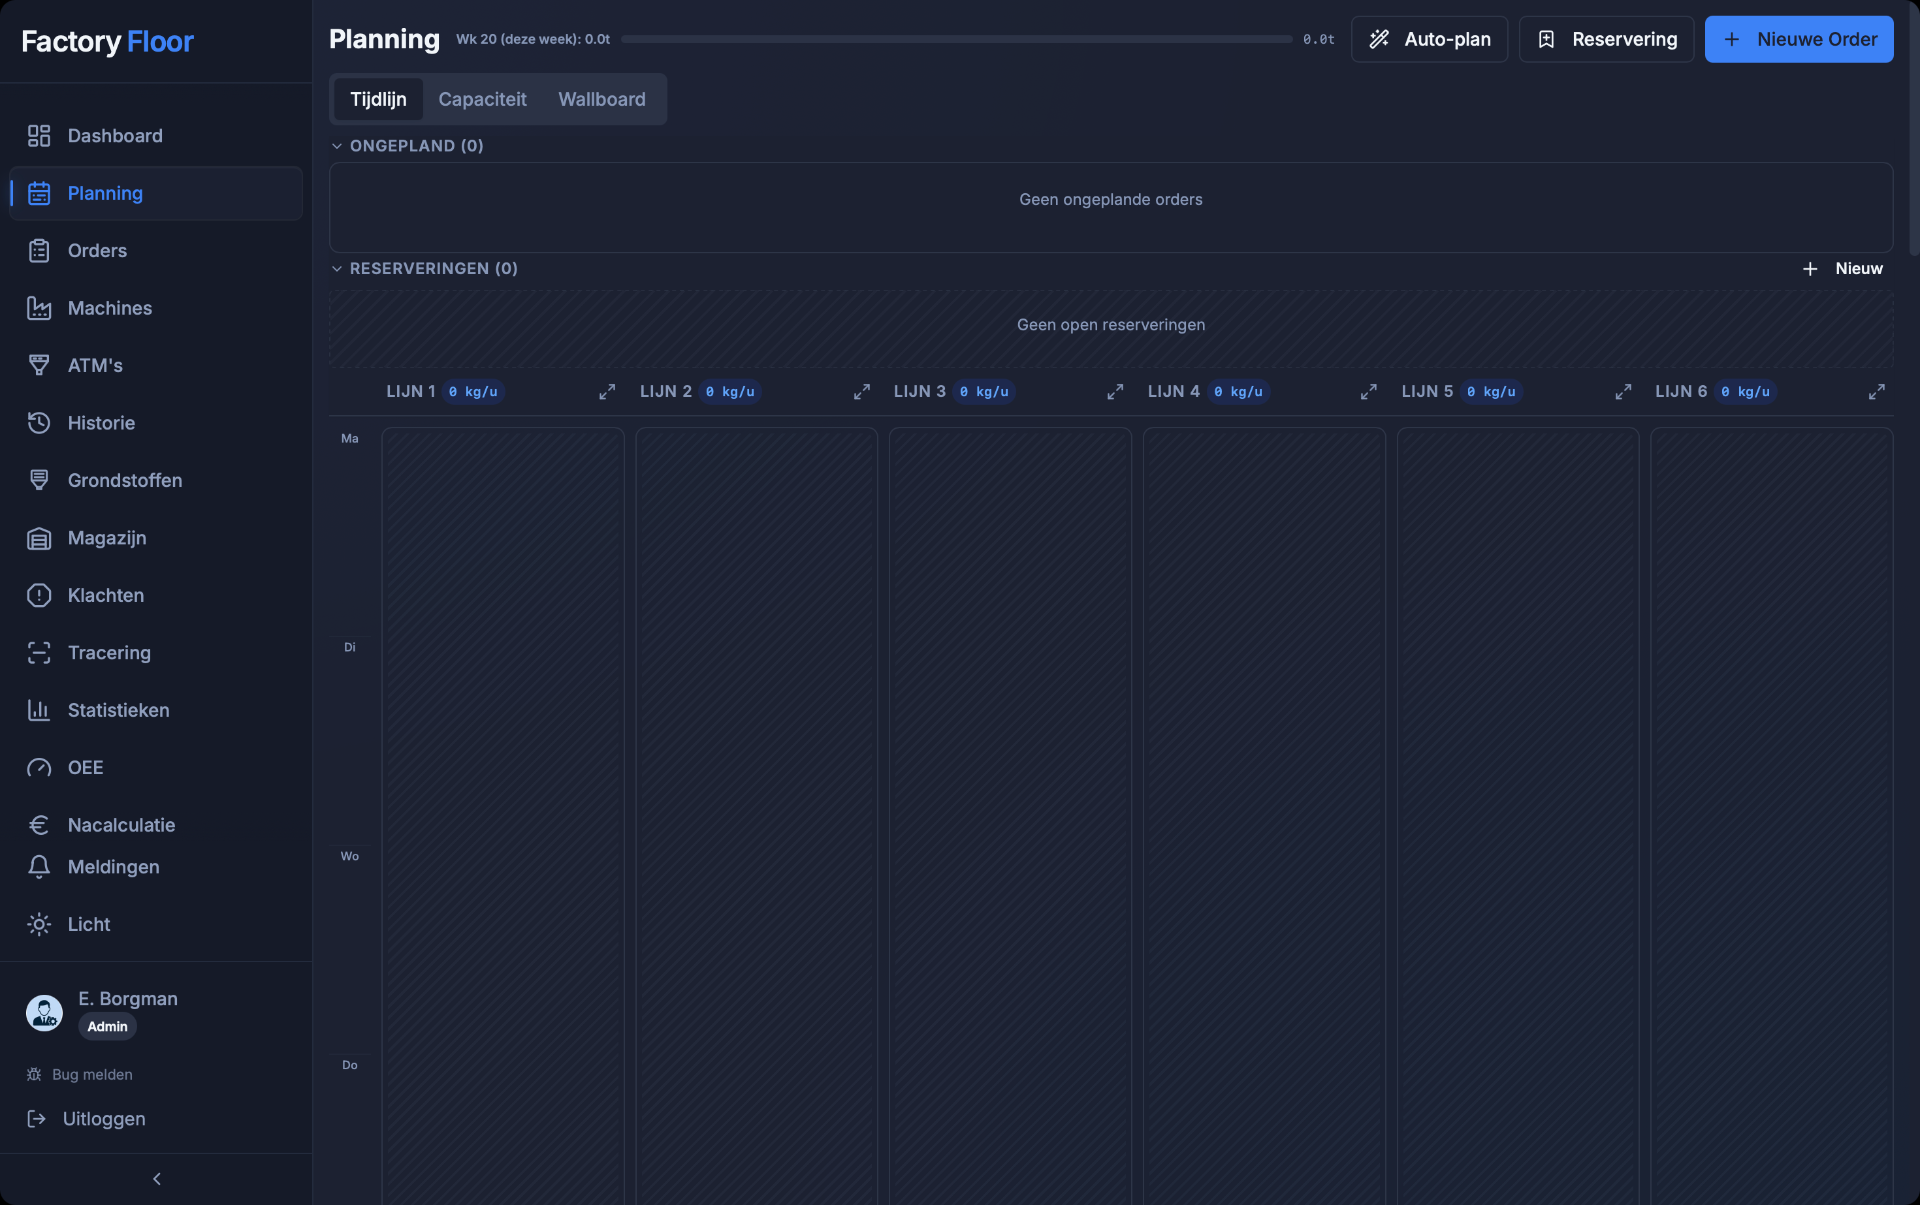
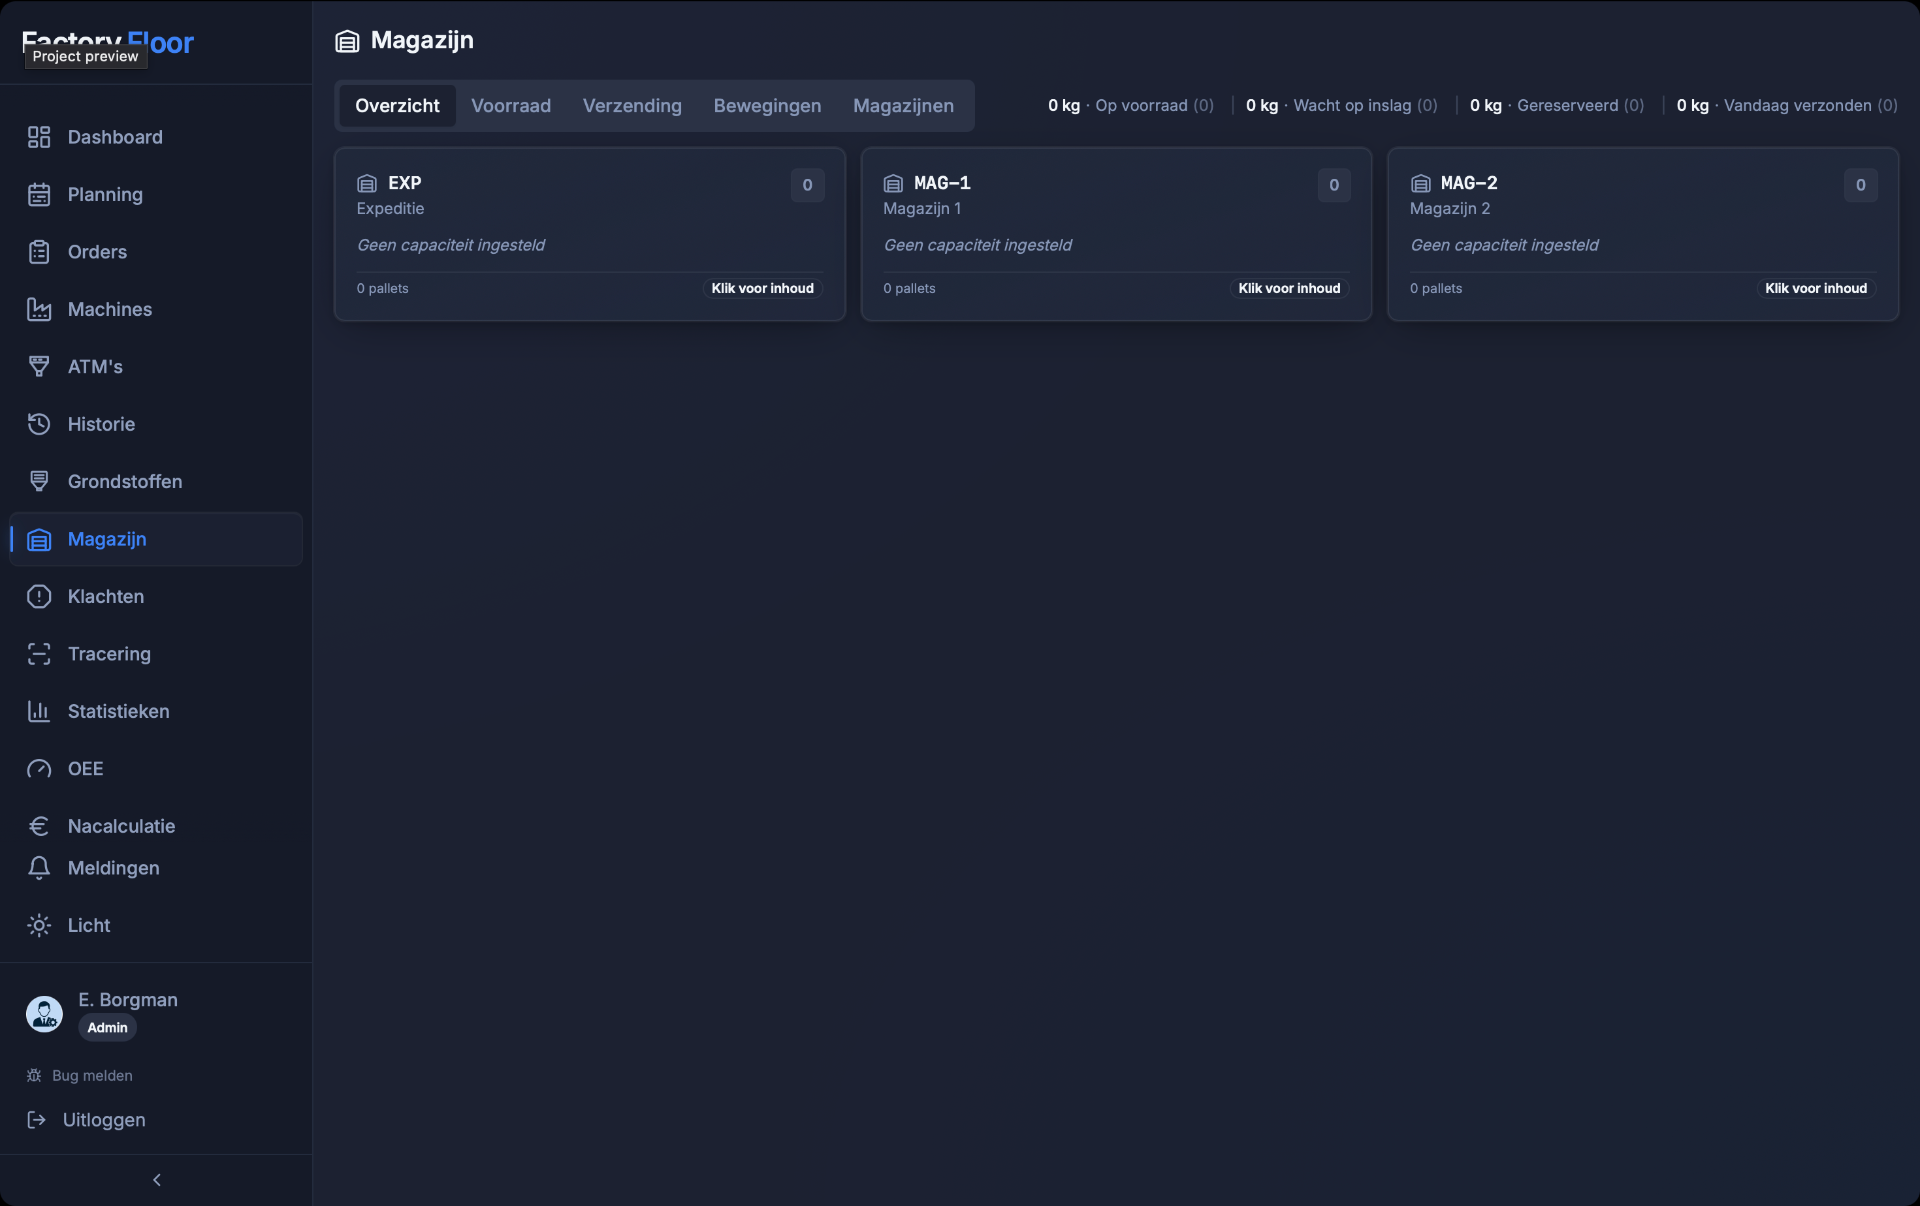
One screen for the whole shop floor — from order to shipment.
No more scattered spreadsheets or paper work orders. One view for planning, production, stock and shipping — up to date and there for anyone who needs it.
Even older machines can speak up.
No built-in connection on your machine? There's often still a way to get the data out — and put it on a screen anyone can read.
- PLC.A3 · cycle 12.4s · ok
- WMS · pick batch #2841 closed
- MES · order 7712 released → line 2
- Sensor.T-09 · 42.1°C nominal
- AI · maintenance window suggested · line 4
Even machines from the '90s with no digital interface can usually be brought into the picture. We tap an existing signal — a contact, sensor or pulse — and send it through a small switch box to your system. There it gets cleanly processed and shown in a dashboard. Live and with history, without touching the machine itself.
Let your systems talk to each other.
I connect your website, software, mail, planning and CRM. Where it makes sense, I add AI to speed things up and make them smarter.
Microsoft 365
Full integration with the tools your team works in every day — mail, chat, documents, spreadsheets and files.
Start small, grow what works.
No 40-page proposals or year-long trajectories. We start with one data stream or one screen that delivers value — then we build out.
On-site intake
I come by, watch the shop floor and listen for where time, information or overview leaks away. No prep required, no strings attached.
One screen live
We pick one concrete step together: read one machine, one dashboard or one internal tool. Visible in weeks, not months.
Build on what works
Did the first step deliver? Then we grow — more machines, more screens, more integrations. Always based on what actually works.
From technician to builder of systems.
I started as a technician and grew into head of technical service and head of production at a plastic film manufacturer — three shifts, six lines, always something broken or worth improving.
Someone asked me if I could make the status of the dryers visible somewhere central. On, off, fault — simple. But once it was running, I thought: what actually happened over the past week? One thing led to another. Before I knew it, I was building a full digital environment for the whole shop floor.
No computer science degree. But ten years of feel for what really matters on a shop floor — where time leaks away, where systems get stuck, and where a good dashboard makes the difference between guessing and knowing.
Systems that work for the people who actually have to work with them.